8 Flower plot
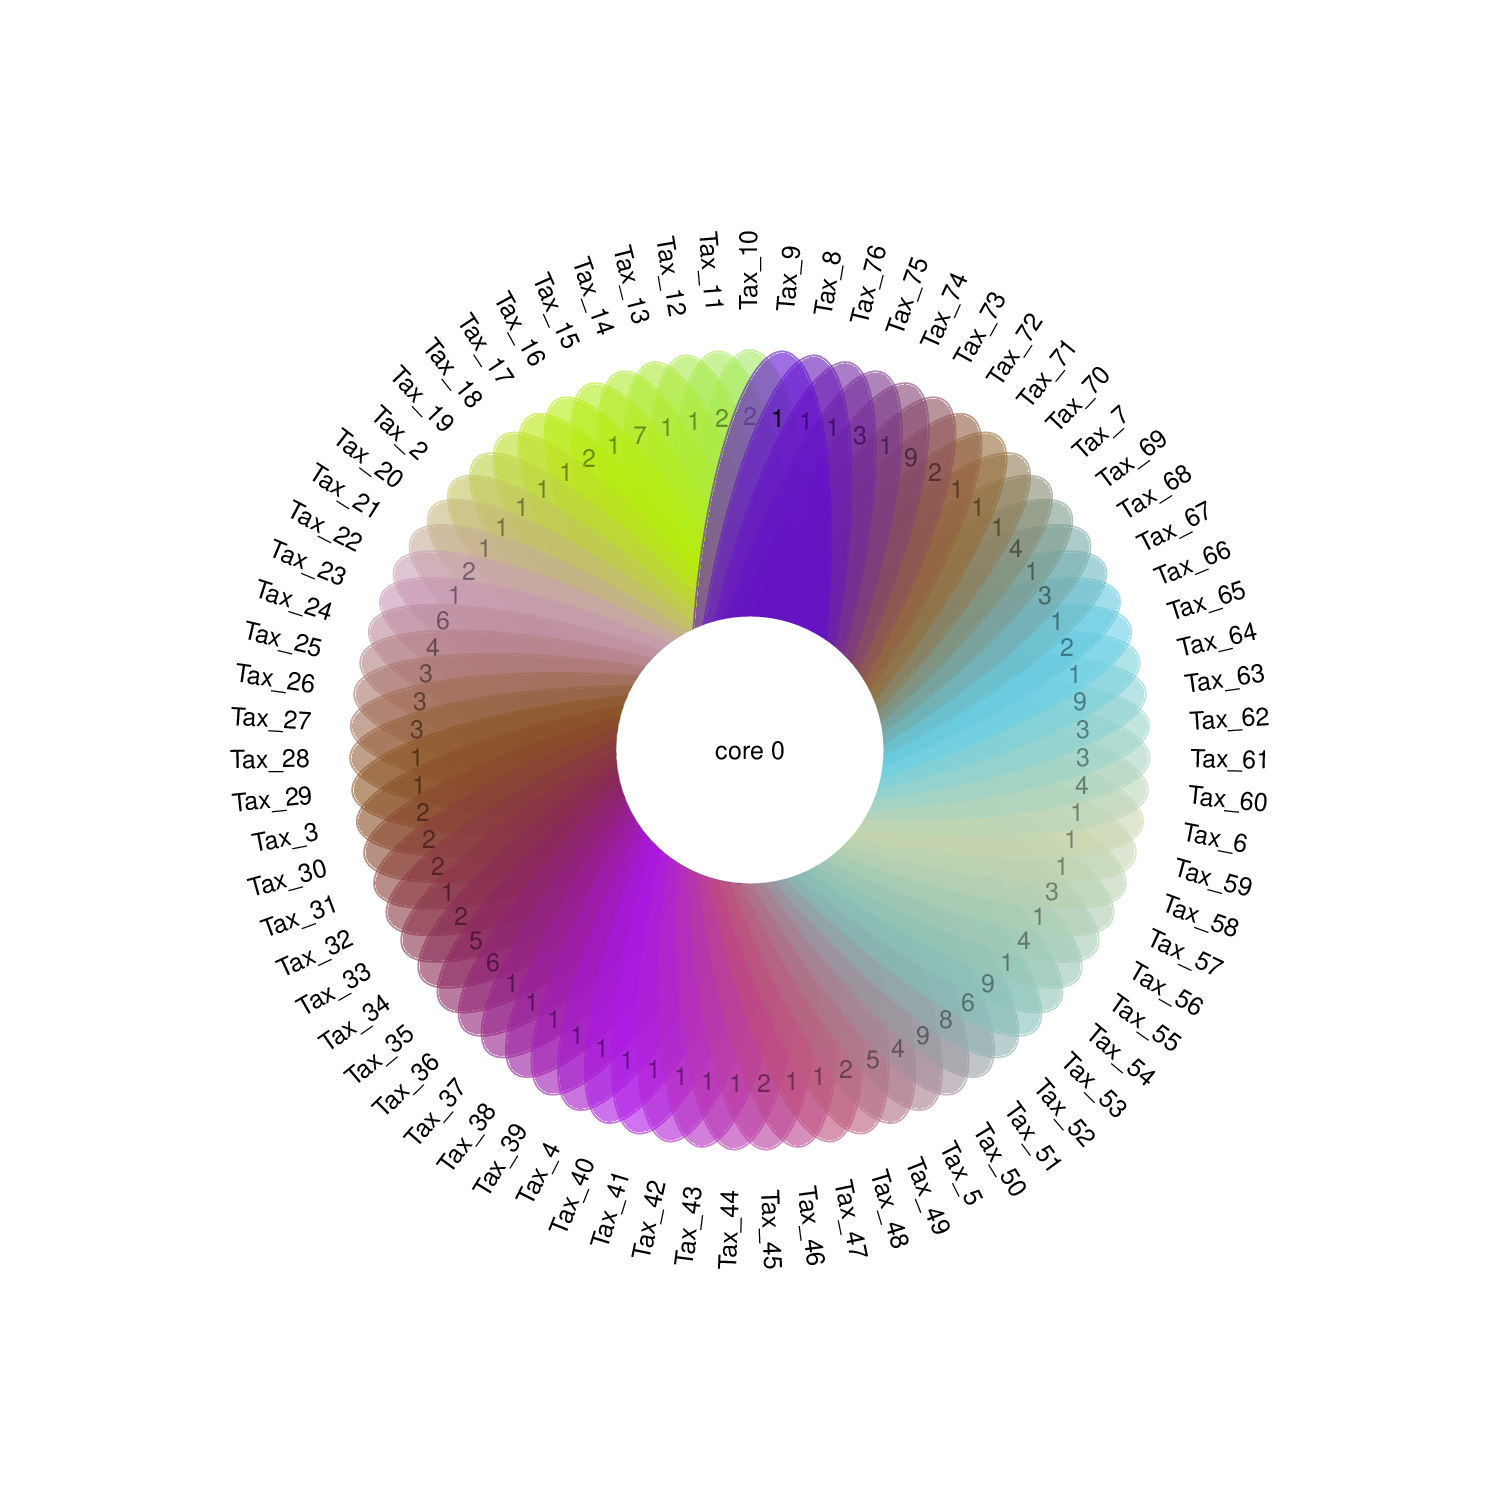
For integrated data with more than 10 or 20 sets, neither Venn diagram, Euler diagram or UpSet (when most intersections are not empty) could give easy displaying. Flower plot which shows only common elements shared by all sets and special elements for each set provides another choice (Fig 8.1). Flower plot would be more useful when displaying commonality or specificity, while other intersection combinations are not so important. There is a trade-off between ease-interpretation and information loss.

Figure 8.1: Flower diagrams for 12 sets. Number of elememnts shared among all sets are labeled in the center circle.
8.1 Two-column mode matrxi as input
The two-column mode format matrix (Fig 3.1 A) is the required input for Flower plot.
8.2 Flower plot using two-column mode data matrix
Here we use an animation showing the simple steps of generating the flower plot with one uploaded two-column matrix (Fig 8.2).
Figure 8.2: Animation illustrating the steps of generating the flower plot with one uploaded two-column matrix.
- First, data matrix could be pasted to the text-area or selected from uploaded files.
- Second, We assume the
firstcolumn containselementsand thesecondcolumn containssetsname and will automatically get the names of each column to fill in. If your data matrix does not follow this assumption, one are allowed to change values of these two drop-down selection boxes. Check the hints (holding the cursor on the question mark symbol) along each parameter for details. - Third, layout and color styles could be changed as required or leaved out for default. Click
Layout and colorsto open/close related parameters. - Forth, the width and height of output picture could be modified (by clicking
Picture attributes). Enlarge this number if the graphic displaying is incomplete. - Fifth, clicking
Submitbutton to get the result in PNG format showing below (could be saves byright clicking on the picture). The result picture could also be downloaded inPDFformat by clickingDownload PDFbutton.
8.3 Color setting for flower plot
See Fig 6.6.