EVenn: Easy to create repeatable, editable, and statistically measurable Venn diagrams online
2024-04-13
1 Overview of EVenn
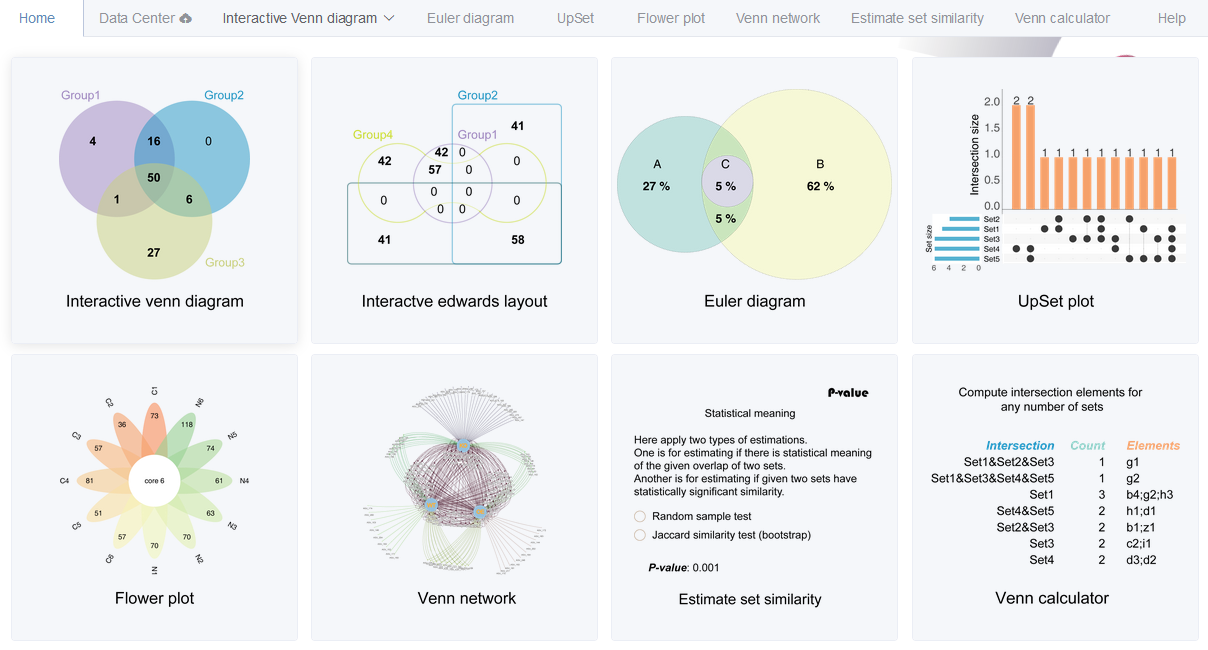
EVenn is constructed to generate Venn diagrams (classical and Edwards layout), Euler diagrams (proportional), UpSet, Flower plot and Venn network. Specially, we developed one unified data matrix as inputs for all tools. This type of input data could be easily prepared using Excel or other text-editors or simple programs. Once uploaded, the data file could be easily loaded to each tool to generate various displaying. This makes EVenn a more suitable tool for exploratory analysis and to choose the best way to explain and visualize data. In order to compute the significance of the overlap between two groups of elements which could be genes or OTUs, random sample test and Jaccard similarity test were applied. The tool Venn calculator could generate the counts and detailed elements for each non-empty intersection for datasets with any number of groups. The results could be used for downstream selection and also could be used as input for data visualization using EVenn. Evenn is available at http://www.ehbio.com/test/venn/. We also recorded a video showing how to generate 5 types of Venn diagrams in less than 3 minutes (which could be viewed in http://www.ehbio.com/test/venn/video/EVenn7.webm or in YouTube with link https://youtu.be/sCEiaZpnL8Q).
EVenn is published in iMeta. Please cite Visualizing set relationships: EVenn’s comprehensive approach to Venn diagrams Mei Yang, Tong Chen, Yong-Xin Liu, Luqi Huang 11 April 2024. https://doi.org/10.1002/imt2.184.
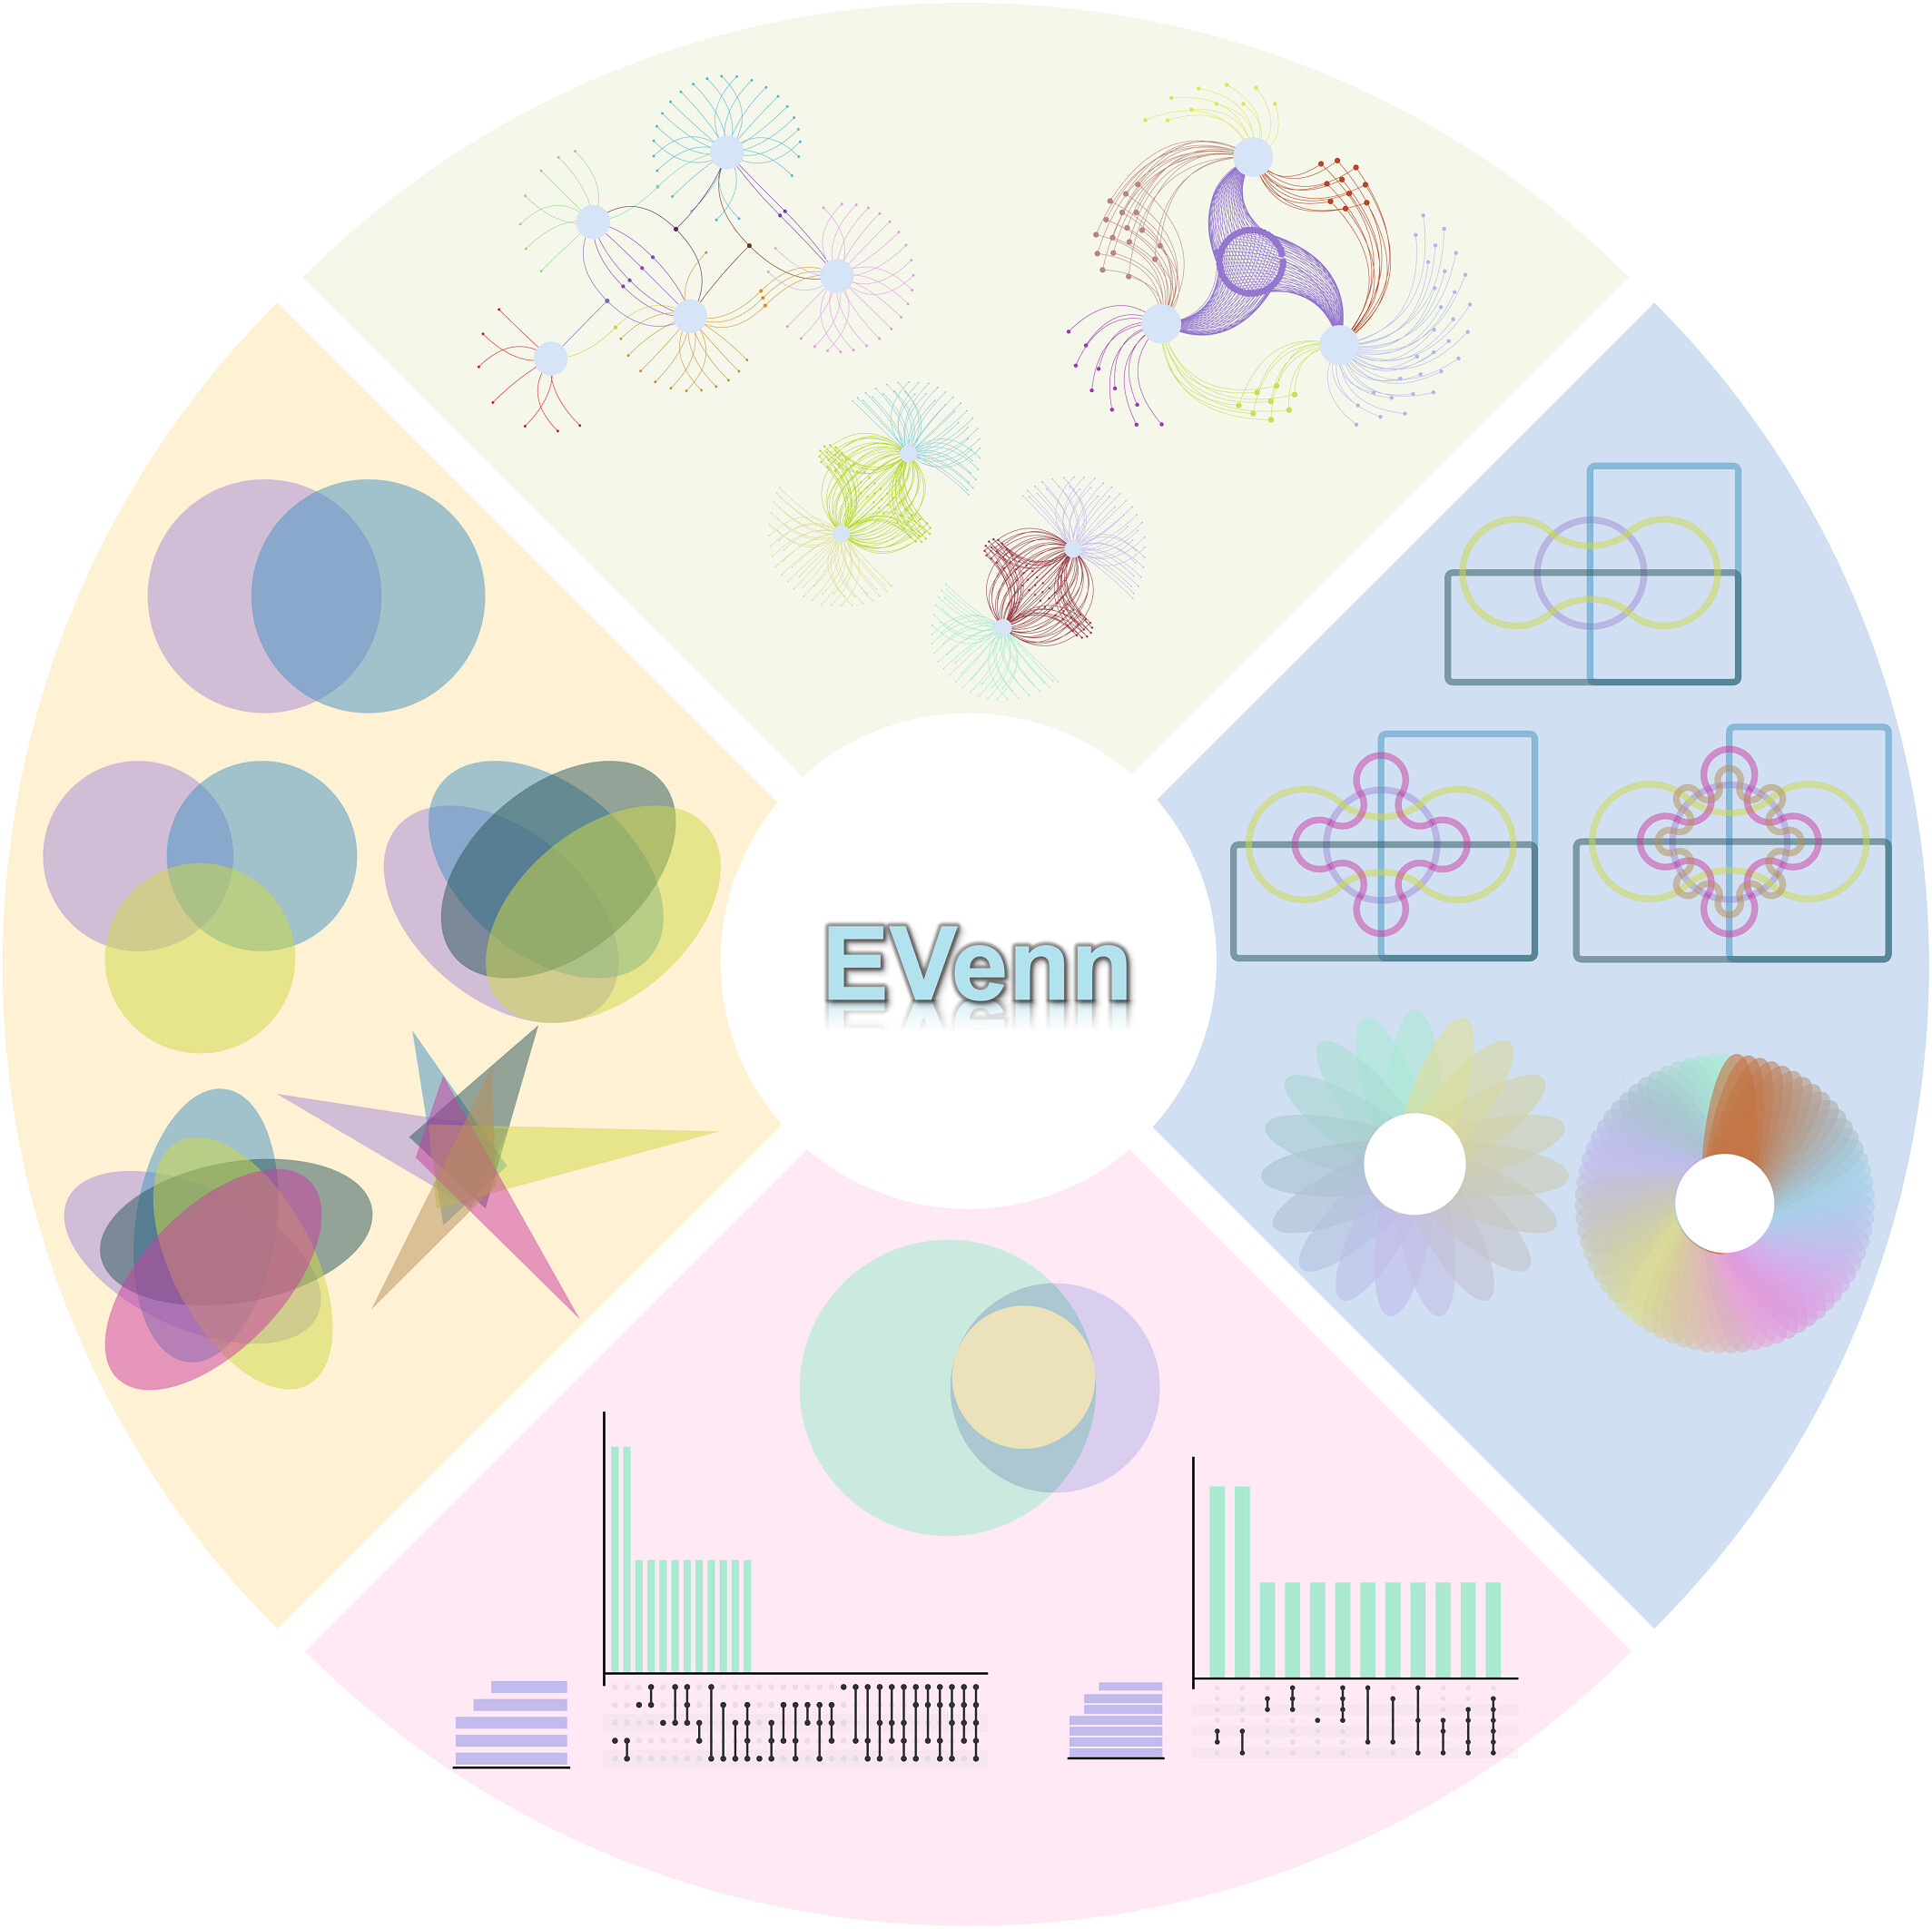
Figure 1.1: 1. 全面的韦恩功能:EVenn提供了一个统一的平台,包含多种韦恩图工具,从交互式图到网络图,满足了代谢组学、基因组学、转录组学和蛋白质组学等多组学数据分析的复杂需求;2. 高效的数据探索:EVenn的数据中心支持标准化的数据格式,简化数据上传和分析过程。本文通过代表性结果和详细案例展示其实用性;3. 用户友好的界面:EVenn拥有易用的界面,简化了各种韦恩图、欧拉图、UpSet图的生成过程。EVenn是研究人员解读多组学数据的好用工具。
1.1 Demo data and animations
Each tool contains at least one copy of demo data for beginners. Normally only one click on the Submit button is needed to generate the demo result.
Pictures and animations illustrating the usages of every tools step by step are recorded in following sections. Left arrow key and right arrow key in the keyboard could be used to navigate this document to change sections.
Some example data are also listed in the second section - Example files.
1.2 Hints for question mark symbol
This may be a common sense that question mark symbol (?) hides help information.
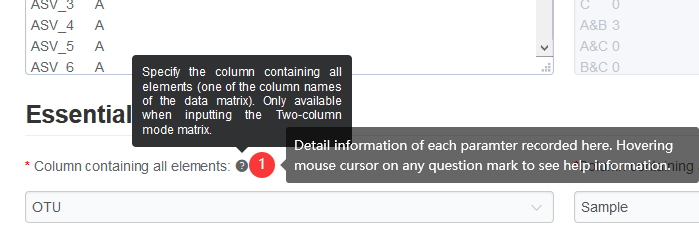
Figure 1.2: Hovering the mouse cursor on any question mark symbol to see help or description information.
1.3 Gallary
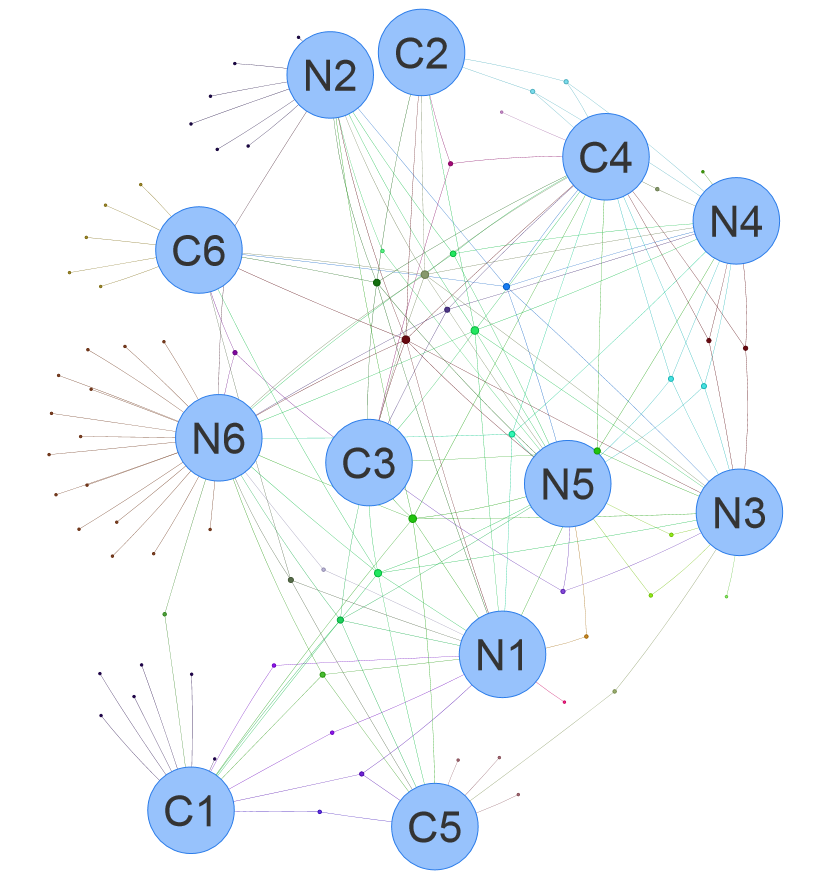
1.3.1 Venn network for OTUs
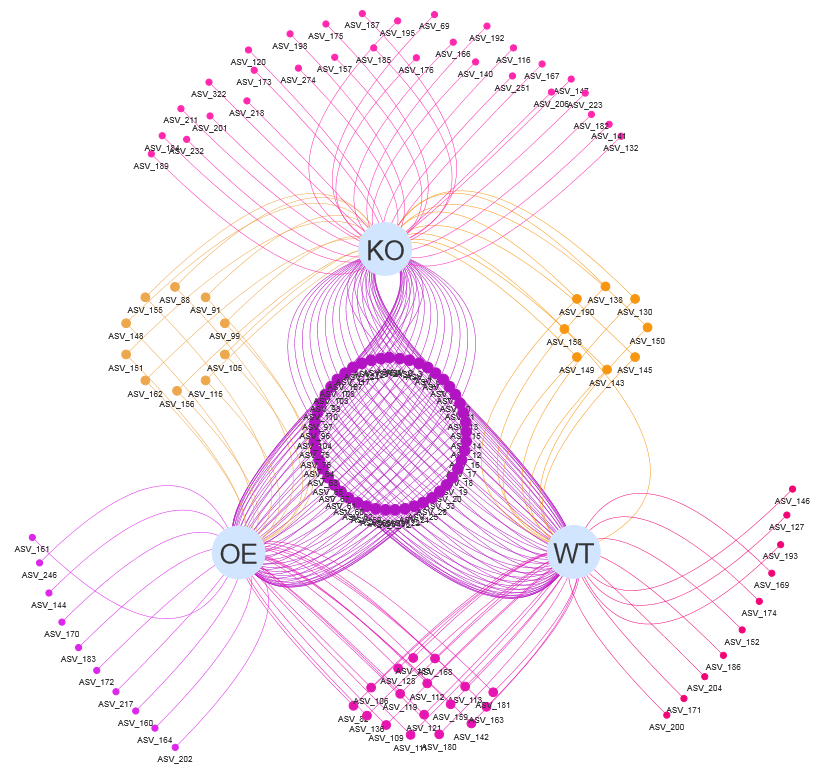
Figure 1.3: Venn network using demo data Click http://www.ehbio.com/test/venn/video/EVennNetwork.webm or https://youtu.be/8zf_XuwaZRw to view the tutorials.
1.3.2 Venn network for DE genes
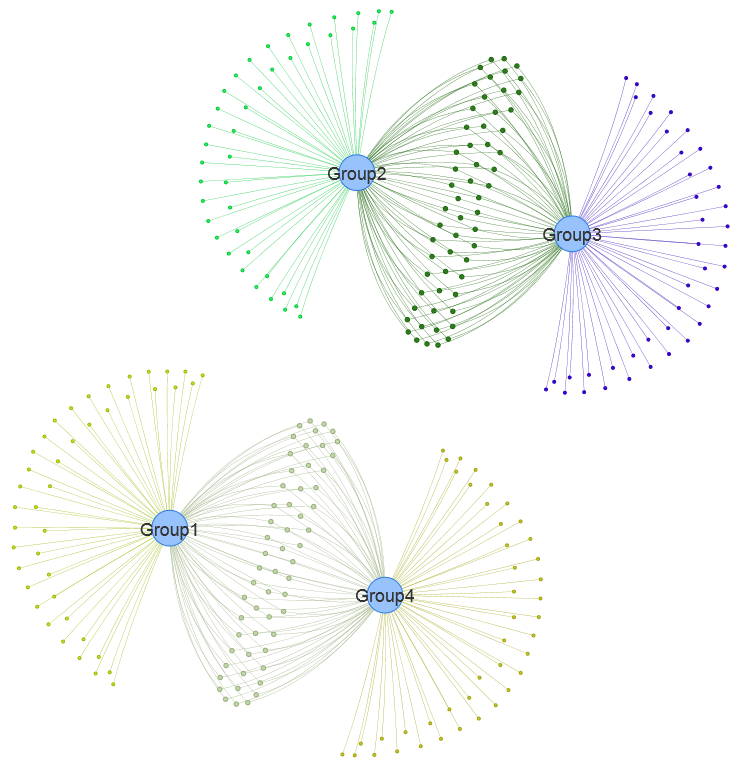
Figure 1.4: Venn network using data <DE_gene_file.txt> in example data.
1.3.3 Venn network for pathway enrichment results
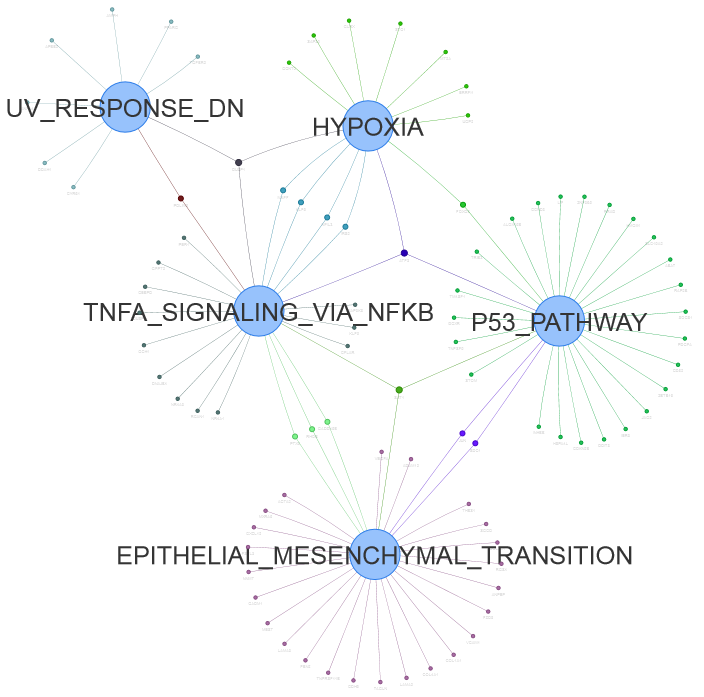
Figure 1.5: Venn network using data <DE_gene_file.txt> in example data.
1.4 How to cite?
EVenn is published in iMeta. Please cite Visualizing set relationships: EVenn’s comprehensive approach to Venn diagrams Mei Yang, Tong Chen, Yong-Xin Liu, Luqi Huang 11 April 2024. https://doi.org/10.1002/imt2.184.
EVenn is published firstly in year 2020 in JGG and has been cited for more than 200 times in two years.